Graph first
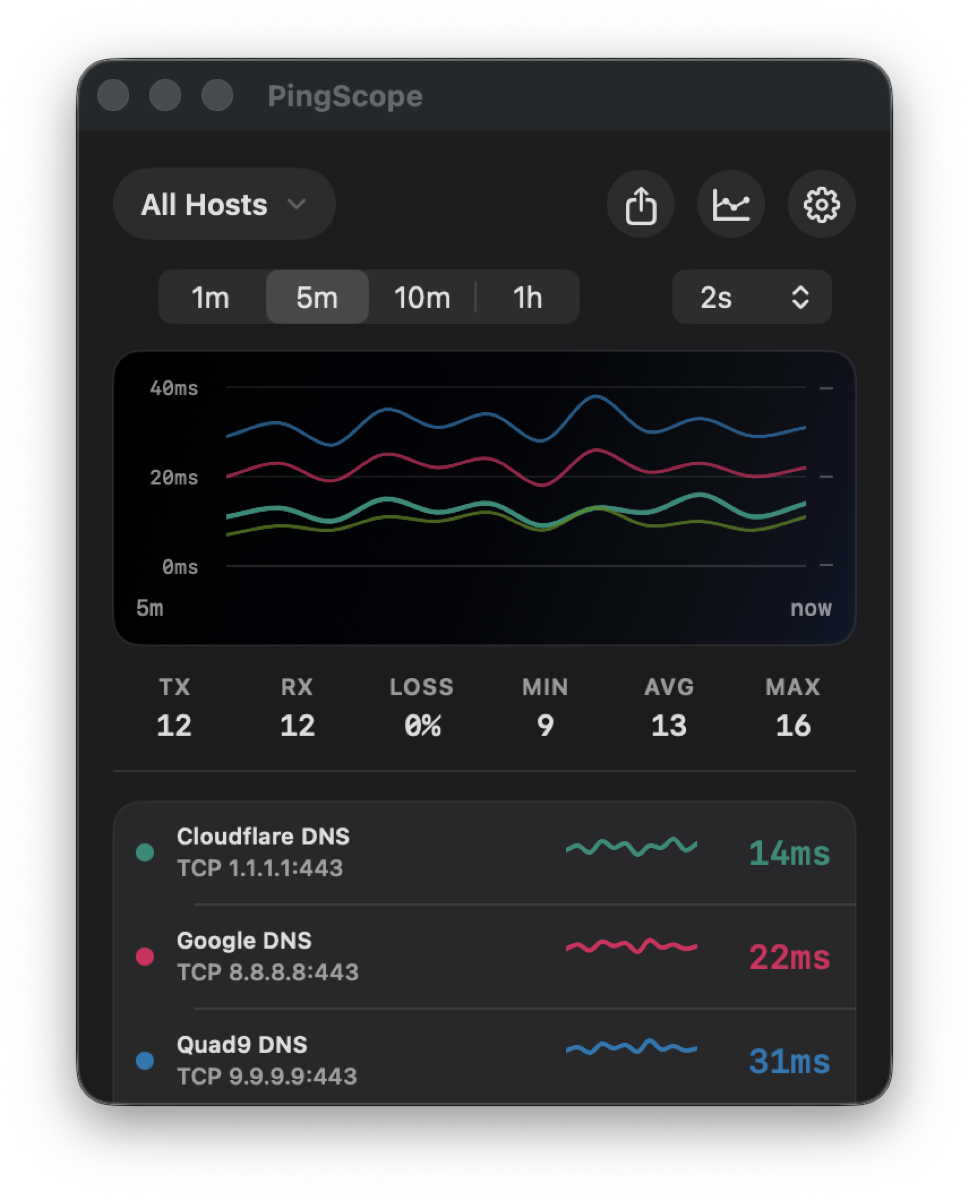
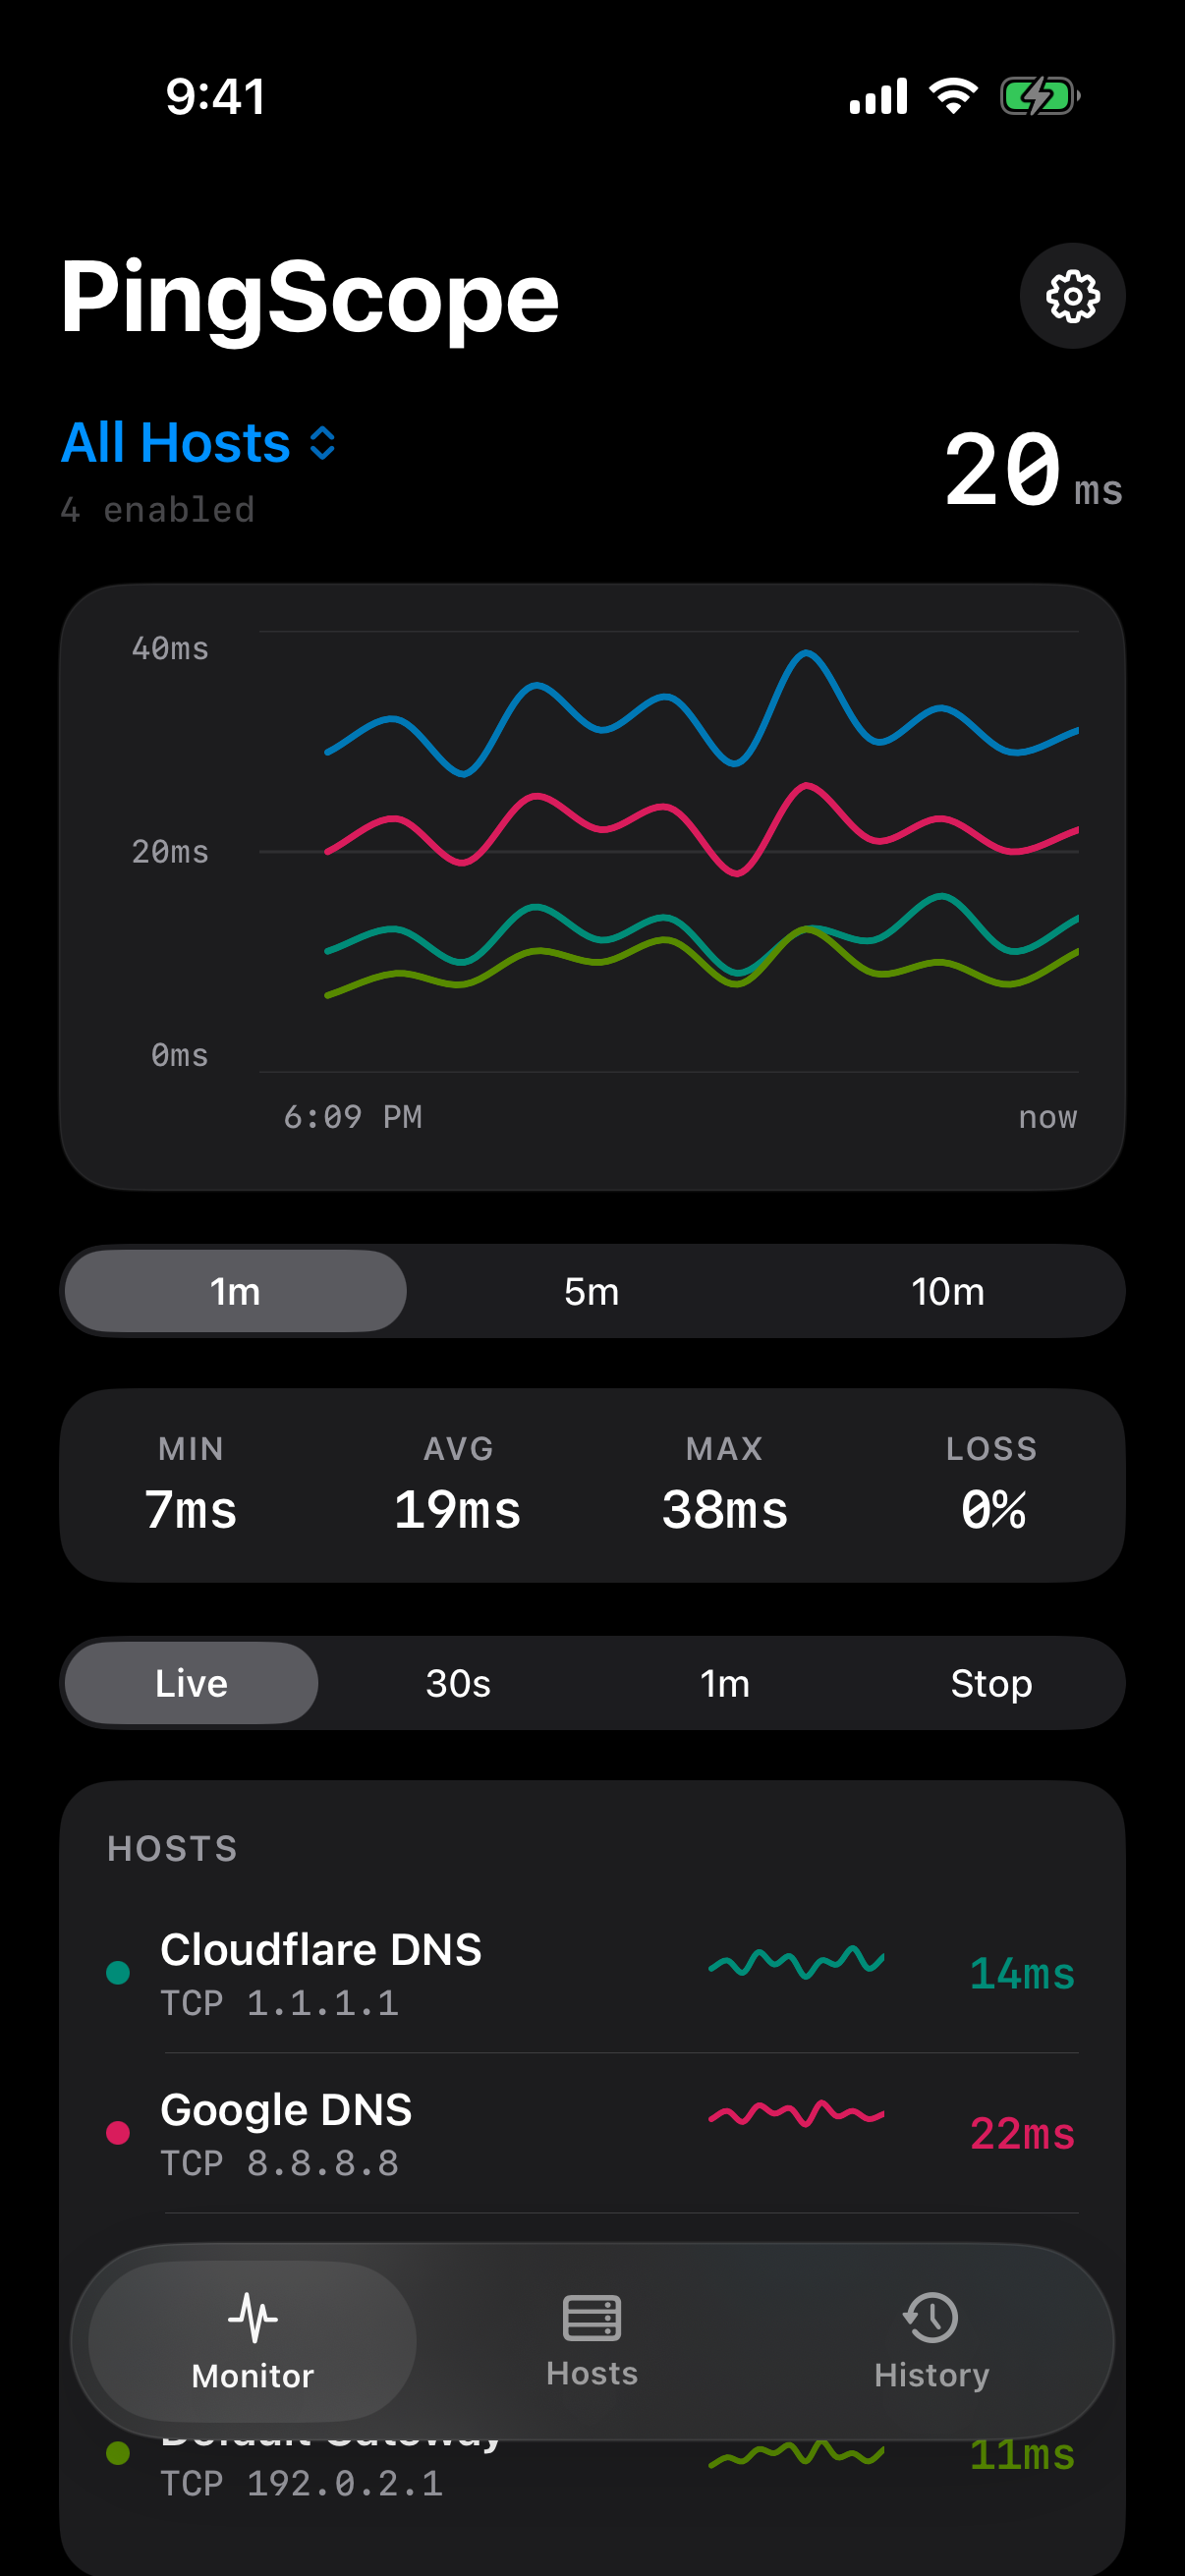
Smooth live histories, compact statistics, and per-host sparklines keep the signal visible without repeating it.
Redesigned for macOS + iPhone
PingScope is a graph-first latency monitor that makes local, upstream, and destination health legible at a glance—across Mac and iPhone.
Latest Developer ID release: v0.5.0. Download information loads from GitHub.
01 / Signal
One glance separates a local failure from an upstream slowdown or a destination problem—before the guesswork starts.
Smooth live histories, compact statistics, and per-host sparklines keep the signal visible without repeating it.
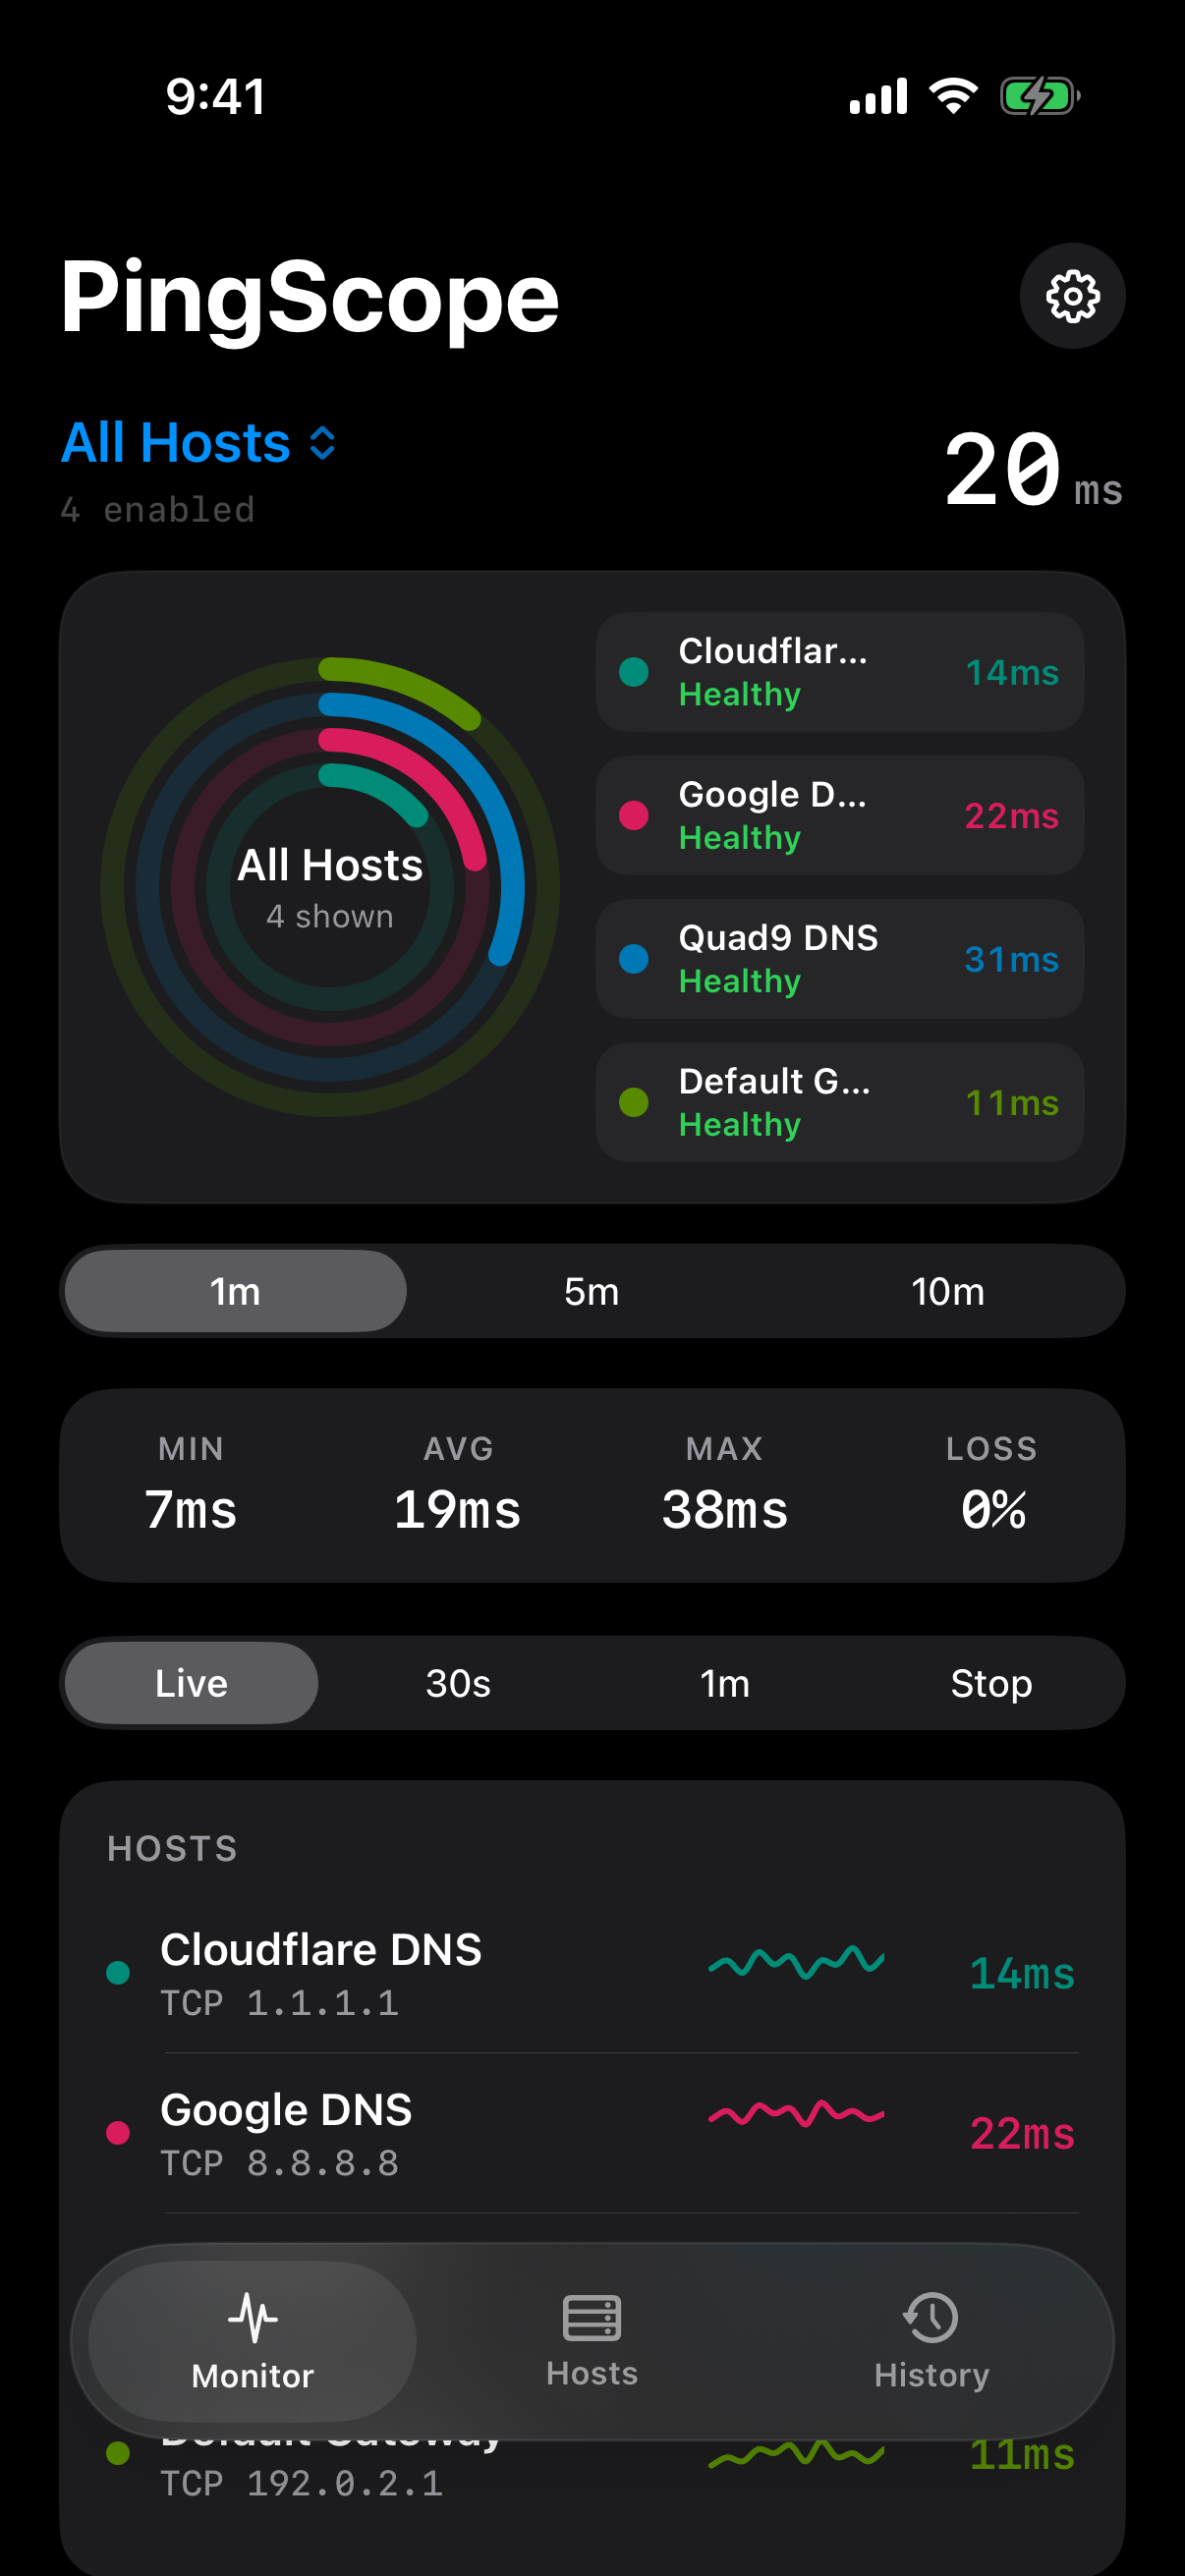
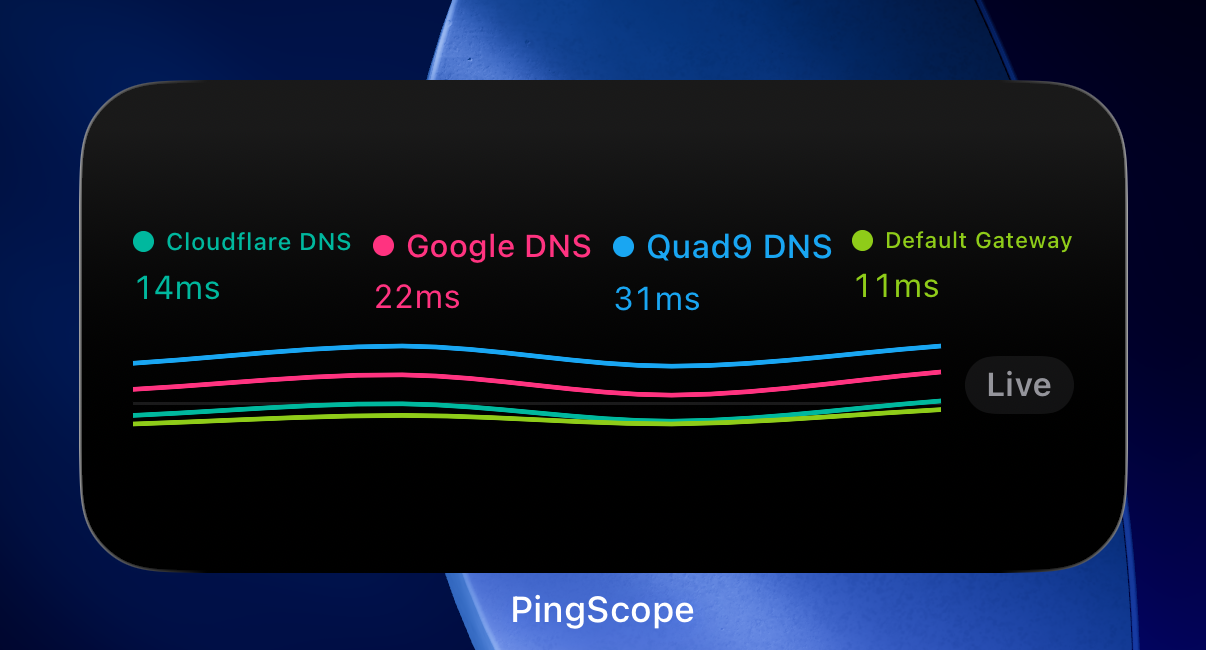
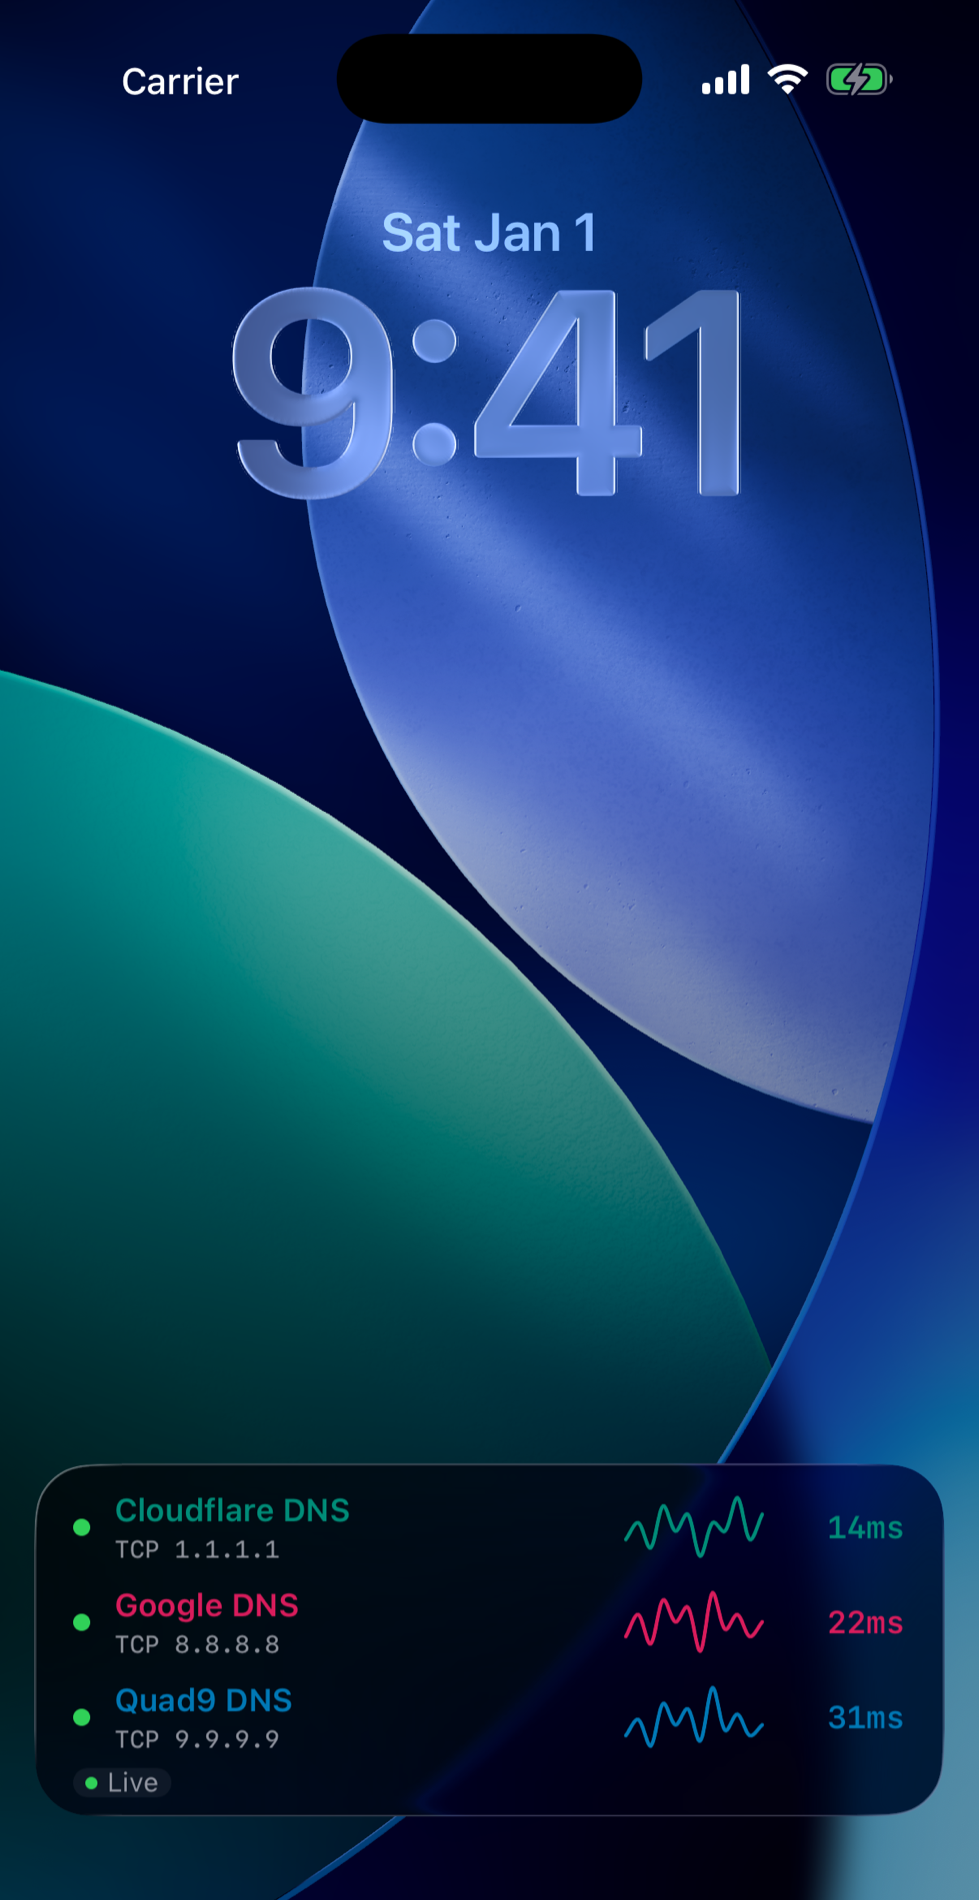
Stable identity colors follow hosts through graphs, rings, widgets, and Live Activities.
Compare gateway, upstream, and destination paths. Connectivity tips are optional and off by default.
02 / Platforms
Use PingScope where the network problem happens. Mac stays close in the menu bar; iPhone carries multi-host monitoring with you.
PingScope for Mac
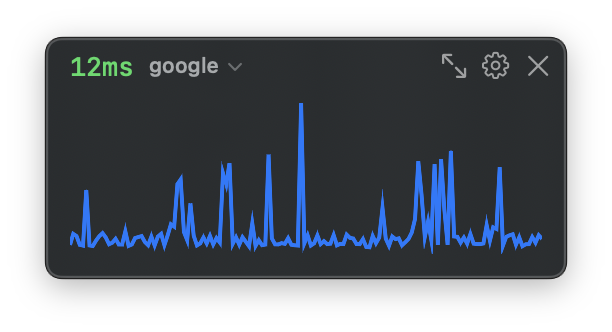
Keep latency in the menu bar, open the detailed All Hosts graph, or pin a compact overlay during calls, uploads, and debugging.
PingScope for iPhone
Compare hosts in one color-matched graph or switch to concentric health rings, then follow the same state from widgets and Live Activities.
03 / Ambient
Color-matched host state stays glanceable on the Home Screen, Lock Screen, and Dynamic Island.
04 / Download
Install from the Mac App Store, join the same external beta on Mac or iPhone, or download the signed Developer ID build from GitHub.
Send a bug report or request to keith+pingscope@hadm.net. The form opens your email app with the fields filled in.